
Resource Analytics
Track resource usage and optimization
Provides infrastructure resource information in a tree structure based on clusters.
Displays resource mapping in the order of Cluster > Node > VM.
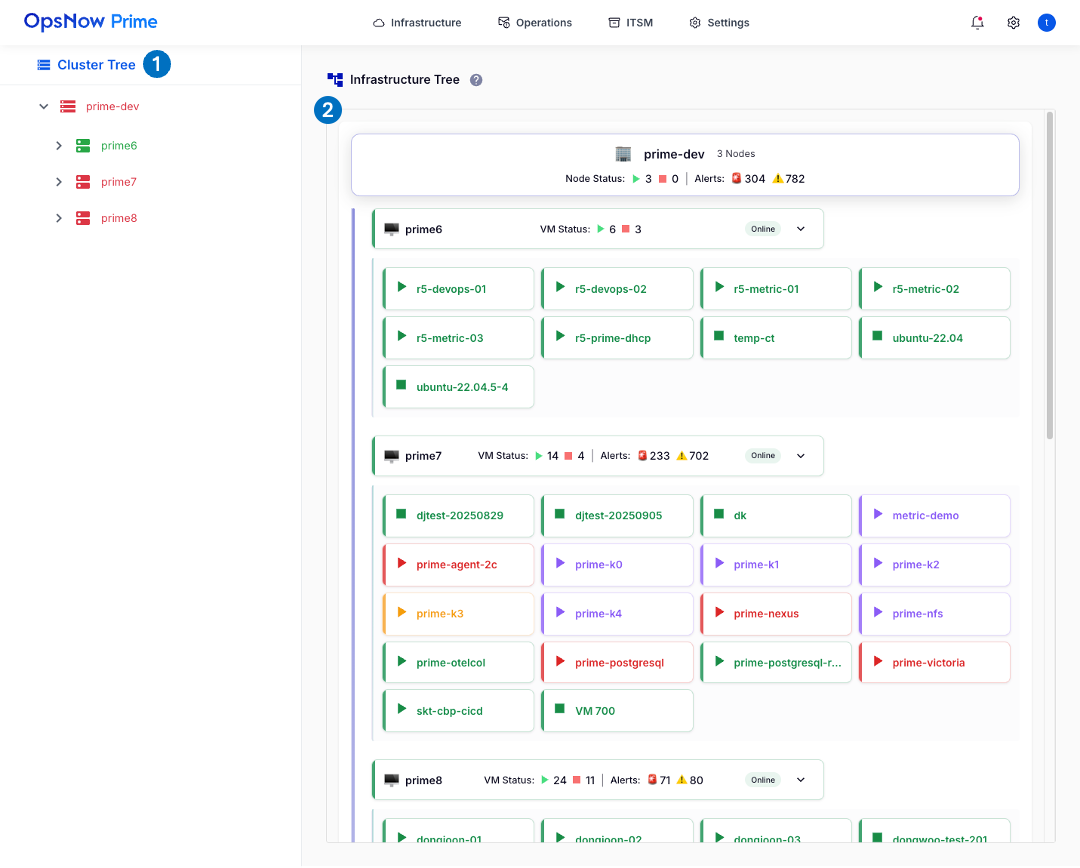
① Cluster Tree
Organizes the hierarchy into a cluster tree structure.
The tree is displayed in the order of Cluster > Nodes.
Clicking an individual resource navigates to its detailed page.
Selecting a Cluster links to the Cluster details page.
Selecting a Node links to the Node details page.
② Infrastructure Tree
Organizes the hierarchy into an infrastructure tree structure.
The tree is displayed in the order of Cluster > Nodes > VMs.
Infrastructure status can be identified by color:
검정색: No Agent Installed
파란색: Agent Installed + No Alert Policy
초록색: Agent + Alert Policy + No Alerts (Healthy)
노란색: Warning Alerts present
빨간색: Critical Alerts present
③ Cluster Details (Page Link)
Displays summary information on cluster status: Critical, Warning, Good.
Critical, Warning, Good
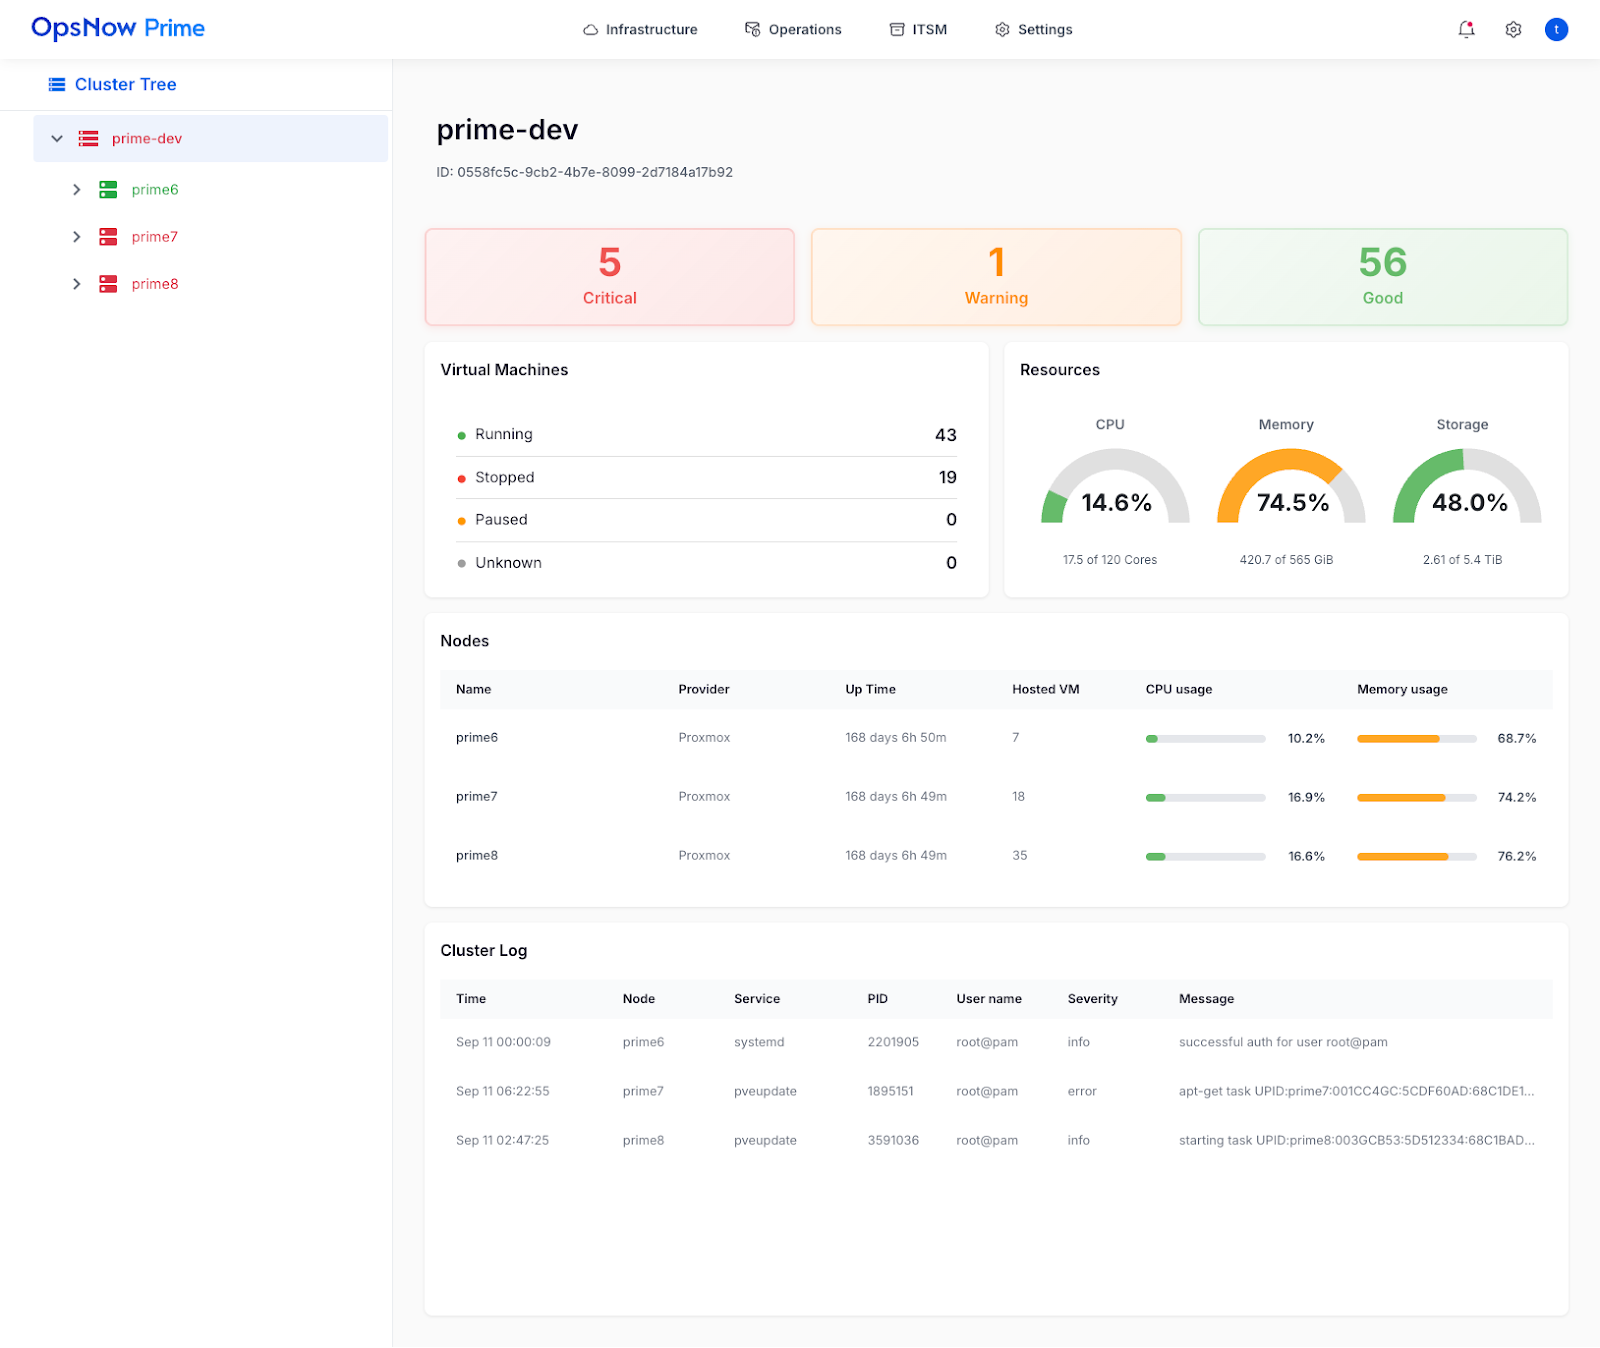
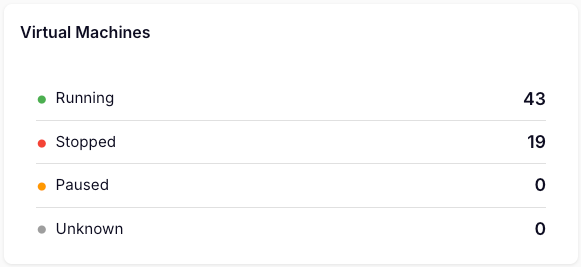
Displays indicators for Virtual Machine operational status.
Running, Stopped, Pauses, Unknown
Displays charts showing utilization per cluster resource.
CPU: Gauge showing usage ratio against allocated CPU
Memory: Gauge showing usage ratio against allocated Memory
Storage: Gauge showing usage ratio against allocated Storage

Displays detailed Node information.
Provider, Uptime, Hosted VM, CPU Usage, Memory Usage

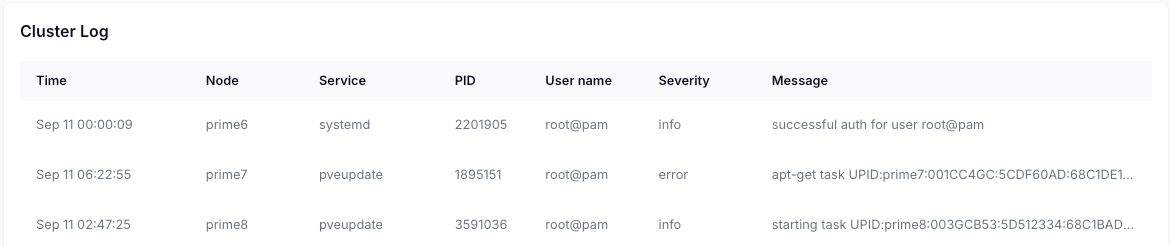
Displays Cluster Log information.
Node, Service, PID, User Name, Serverity, Message
④ Node Details (Page Link)
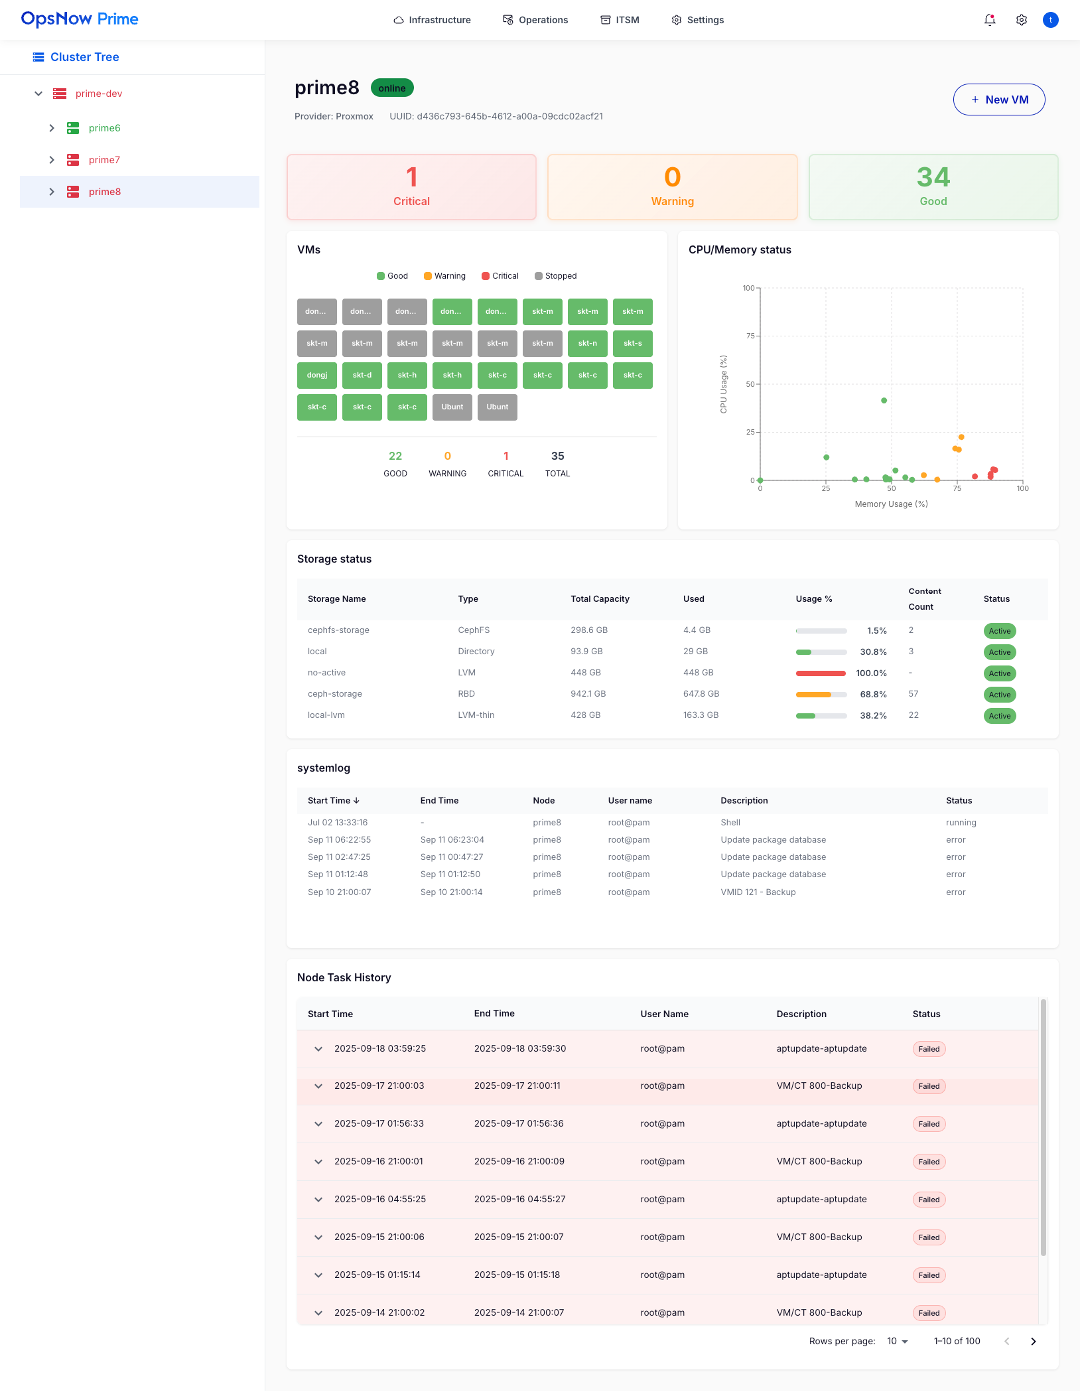
A summary of the status of nodes assigned to the cluster is displayed on the screen.
Critical, Warning, Good

Visualizes the status and operational state of Virtual Machines on a map.
Good (Green), Warning (Orange), Critical (Red), Stopped (Gray)
The operational status of all allocated VMs is shown by color.

VDisplays VM resource usage as a scatter plot.
Y-axis: CPU Usage
X-axis: Memory Usage
Hovering with the mouse shows detailed information below.
Memory, CPU, Status, Type, CPU Cores, Memory, Disk, Uptime

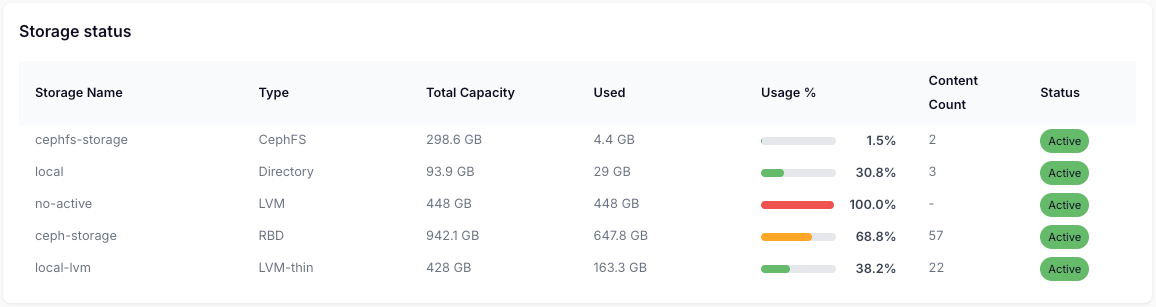
Storage status displays detailed storage information in a table format.
Storages Name, Type, Total Capacity, Used, Usage, Content Count, Status
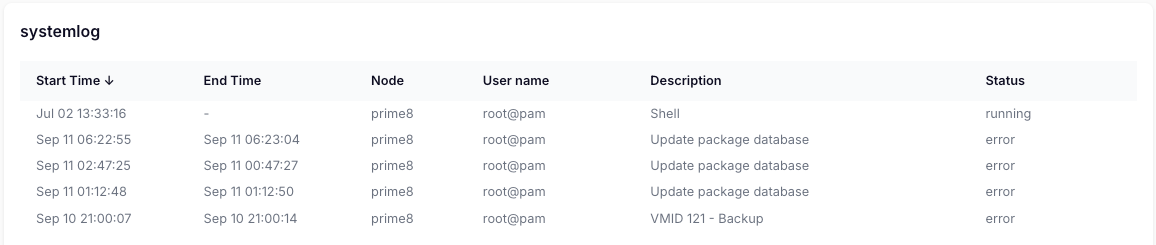
Systemlog displays detailed system log information in a table format.
Start Time, End Time, Node, User name, Description, Status
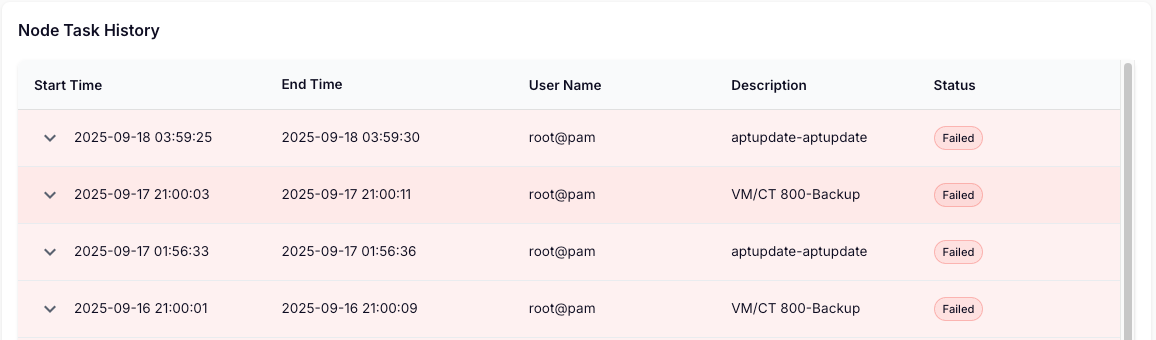
Node task history displays detailed node task history in a table format.
Start Time, End Time, User name, Description, Status
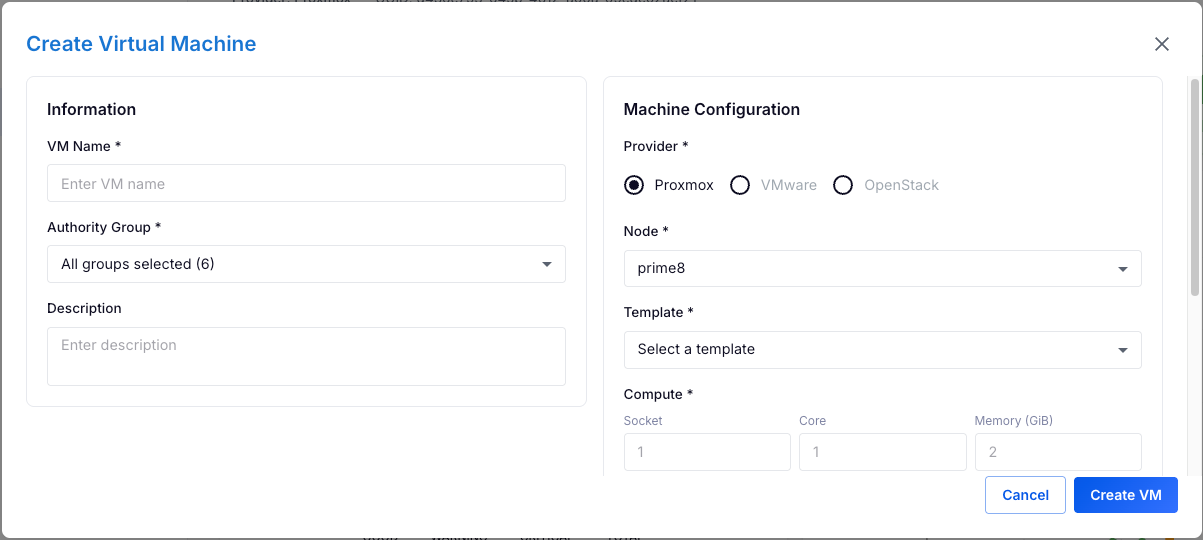
New VM
Provides a tool for creating Virtual Machines.
Information
VM Name
Authority Group: The groups registered under Group Management are displayed.
Description
Machine Configuration
Provider: Proxmox, VMware, OpenStack
Node
Template
Compute: Socket, Core, Memory
OS/Storage
OS & Storage
OS, Storage 항목은 템플릿 형태로 자동으로 채워지며, 선택할 수 있습니다.
Cloud Init: IP Address, Gateway
Last updated